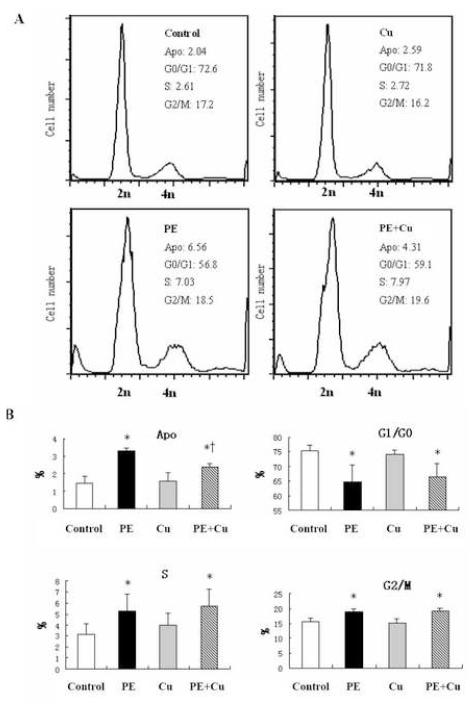
Figure 5.
Flow cytometry analysis of cell cycle. At the end of Cu treatment as described in Figure 1, the cells were collected, fixed, and incubated with PI as described in the Materials and Methods. The cells were then subjected to flow cytometry analysis and 30,000 cells in each sample were counted. A. Representative histograms demonstrating the distribution of cells in cell cycle under different experimental conditions. B. Quantitative analysis of the distribution of cells in cell cycle (% of cells in each phase relative to the total population). Apo: Cell population with diminished DNA content, referred to as apoptotic population; G1/G0: Cells in quiescent or early G1 phase, as defined with 2n DNA content; S: Cells in DNA synthesis phase, 4n DNA content; G2/M: G2 and Mitotic population. The labels for the treatment conditions are the same as described in Figure 2. Each group of data were obtained from three independent experiments and each experiment contains a triplicate samples for each treatment. Values are means ± S.E.M. *, significantly different from control group and †, significantly different from PE-treated group (p < 0.05).

