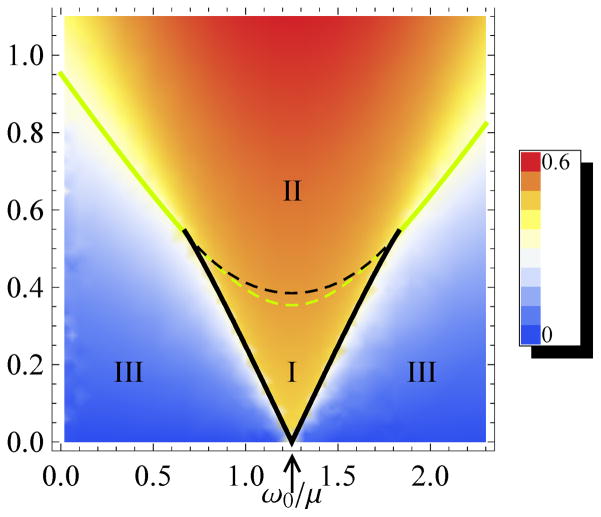
FIG. 4.
Phase-locked amplitude as computed from Eq. 1, using scaled variables F/μ3/2 and ω/μ. The black lines indicate Saddle Node on an Invariant Circle (“SNIC”) bifurcations and the yellow lines Andronov-Hopf bifurcations. They meet at a Bogdanov-Takens (BT) bifurcation. The intersection of the phase-locked region with the horizontal axis at the tip of the triangle is ω0/μ. Tr[A]=0 along the yellow dashed line, and Det[A]=0 along the black dashed line. These additional bifurcations are not detected experimentally as the system remains mode-locked in both regions I an II.

