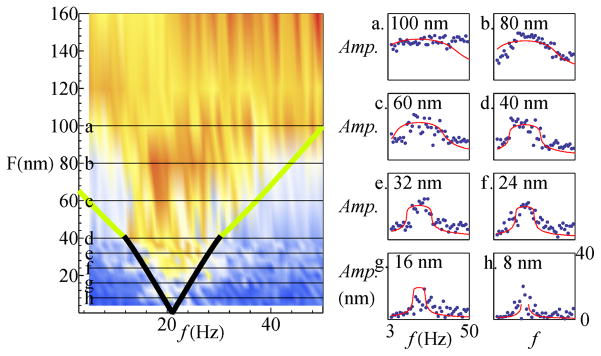
FIG. 5.
Data and numerical fits to slices through the Arnold Tongue, taken along the horizontal axis. The data are indicated with blue dots, and the red lines show the numerical fits. The Bogdanov-Takens boundary point was selected to correspond to the point of inflection seen in the experimental plot, and the characteristic frequency ω0 to match the peak in the response (Fbt = 40 nm and fbt = 12 Hz, with characteristic frequency f0 = 21 Hz). The scaling factor μ for the overall response was varied to optimize the fits; no additional free parameters were introduced. (Fscale = 24.09 = Fbt/(0.53 μ3/2), fscale = 7.52 = (f0 − fbt)/(0.56 μ), μ = 2.14 ω0/μ = f0/fscale/μ = 1.3) Note: We fixed the intersection between the two curves, trace = 0 and det = 0, to be at the above points. This falls in the close vicinity rather than exactly at the Bogdanov-Takens point [24]. As these are indistinguishable experimentally, we refer to this as the BT point for conciseness.

