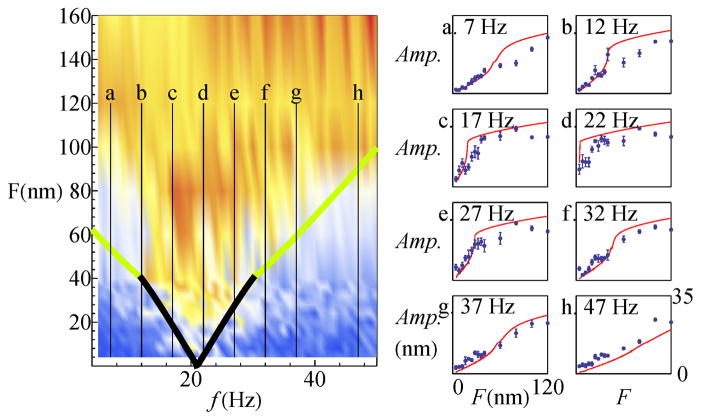
FIG. 6.
Data and numerical fits to slices through the Arnold Tongue, taken along the vertical axis. The data were binned into 5 Hz intervals, with blue dots (indicating the average of five neighboring frequencies), and the error bars showing the standard deviation of the phase-locked amplitude. The red lines show the numerical fits. (Scaling an fitting parameters are the same as for figure 5.)

