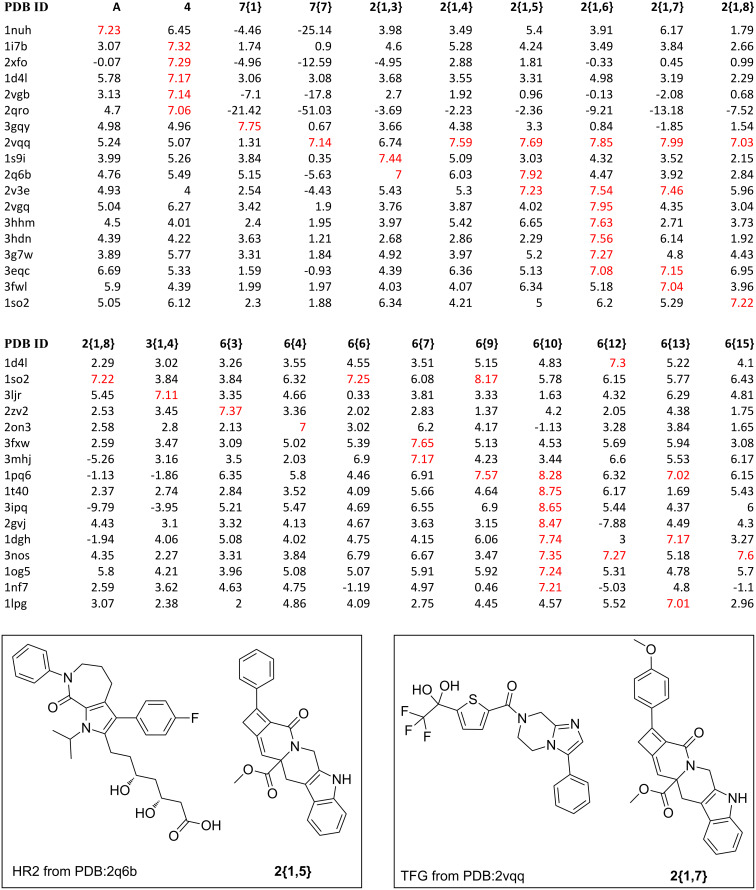
Figure 3.
Results of high-throughput docking analysis. Top: A docking-score matrix arranged by compound IDs and PDB IDs; bottom: Structures of known ligands HR2 and TGF and the newly synthesized compounds 2{1,5} and 2{1,7}. Docking scores larger than 7.0 are red colored and can be mapped to Kd values less than 100 nM. The corresponding protein names of PDB IDs and the full docking-score matrix are listed in Supporting Information File 1.

