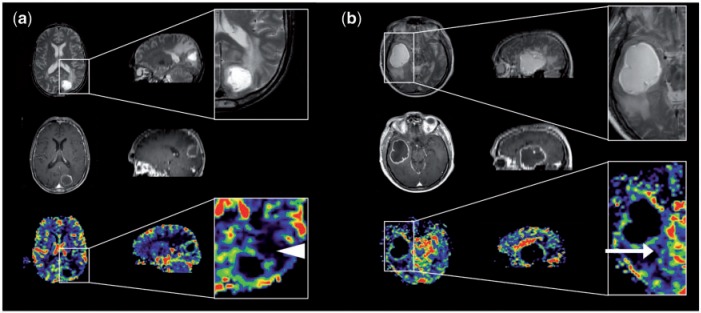
Figure 3.
Perfusion imaging in (a) solitary cerebral metastasis and (b) GBM (axial imaging on the left and sagittal reformats on the right). Top row: T2-weighted imaging. Middle row: post-contrast T1-weighted imaging. Bottom row: CBV maps. Magnified images of CBV maps and corresponding T2-weighted images. (a) The peri-lesional non-enhancing tissue surrounding the metastasis exhibits a very low relative CBV (white arrowhead) and represents vasogenic oedema; (b) the peri-lesional non-enhancing tissue surrounding the GBM has a slightly higher relative cerebral blood volume (white arrow) and represents infiltrating glioma.

