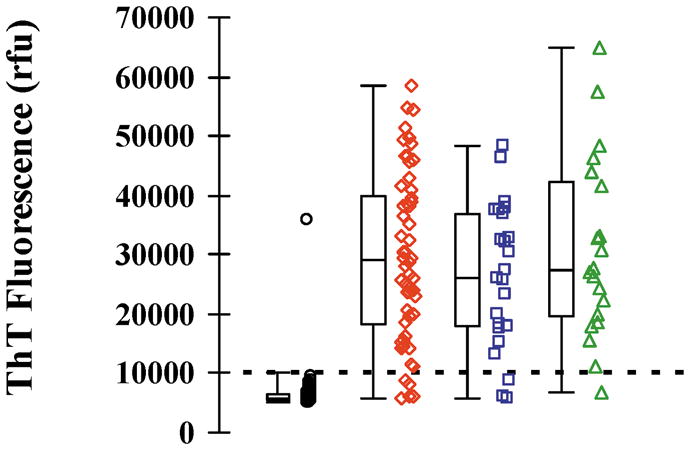
Figure 3.

Combined scatter and box and whisker plots of the CSF RT-QuIC rfu in control patients (○), sCJD – MM genotype (◇), sCJD – MV genotype (□) and, sCJD – VV genotype (△). Each point represents the average of the two highest rfu readings for each patient investigated. Box and whisker plots show the 2nd, 25th, 75th and, 98th centiles.
