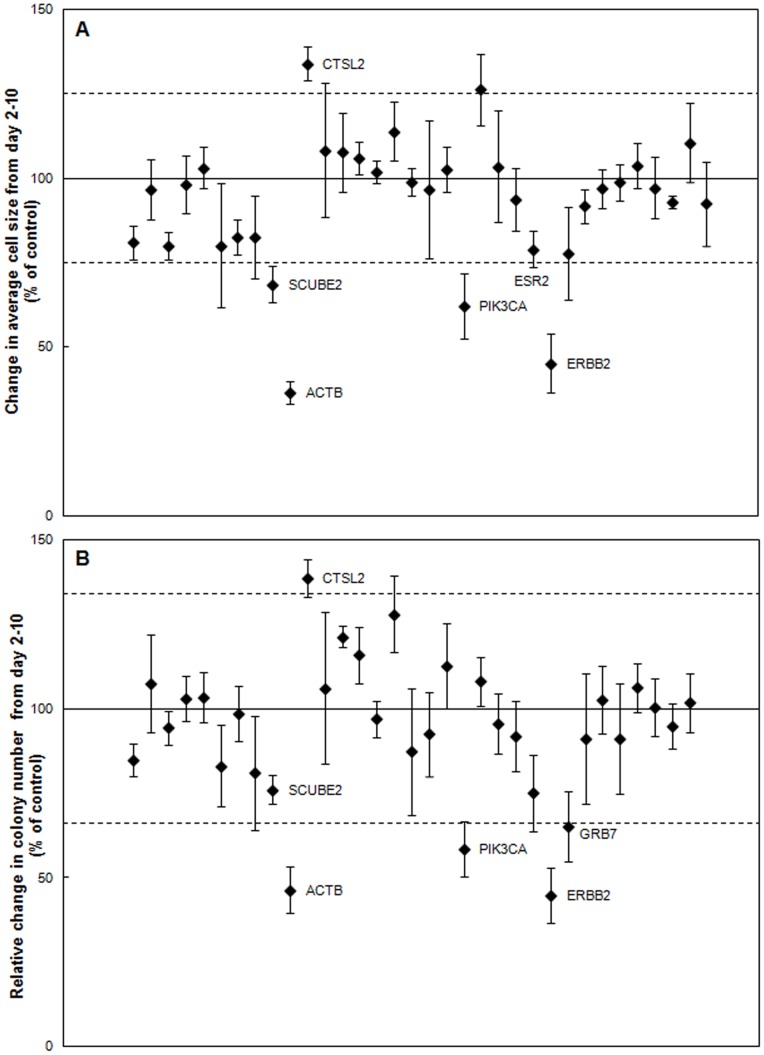
Figure 5. Identification of inhibitors of SK-BR-3 cell growth on the CBC-1.
A) Change in average SK-BR-3 cell size from day 2–10 normalized to control (n = 3–5). B) Relative change in SK-BR-3 colonies between day 2–10 normalized to control (n = 3–5). Labeled siRNAs are significantly different from control in A & B (p<0.05). Dashed lines represent two standard deviations away from the control mean.

