
Figure 6. Representative images showing the suppression of SK-BR-3 cell growth over time caused by ACTB siRNA.
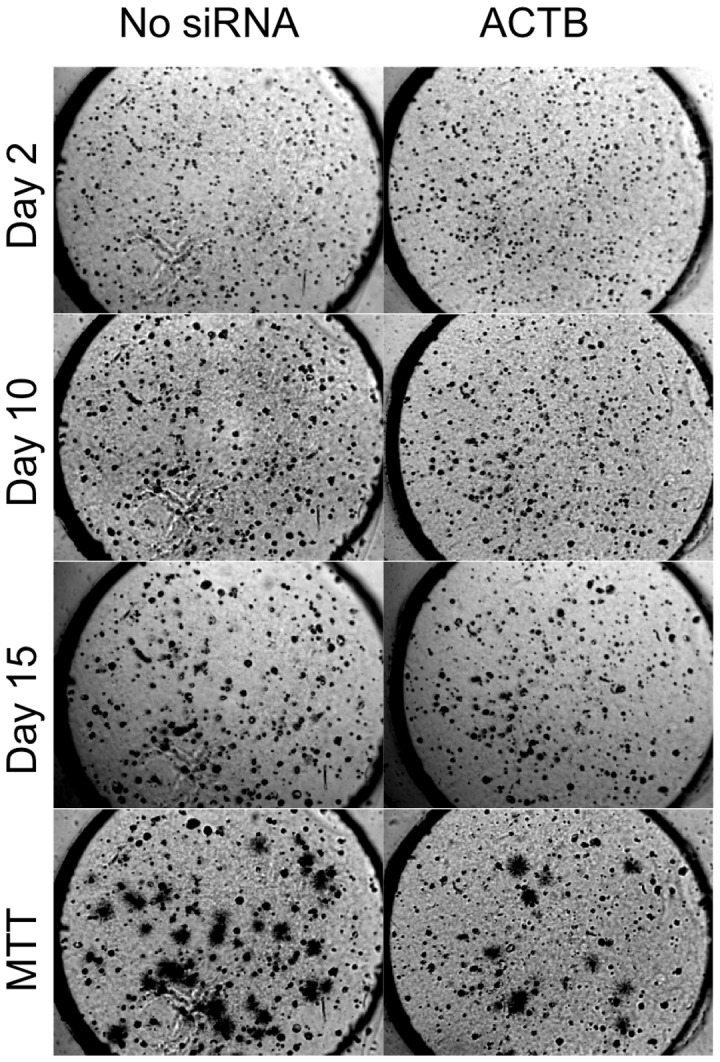
Live colonies were stained with MTT on day 15. Each well is 3 mm in diameter.
Official websites use .gov
A
.gov website belongs to an official
government organization in the United States.
Secure .gov websites use HTTPS
A lock (
) or https:// means you've safely
connected to the .gov website. Share sensitive
information only on official, secure websites.
Live colonies were stained with MTT on day 15. Each well is 3 mm in diameter.