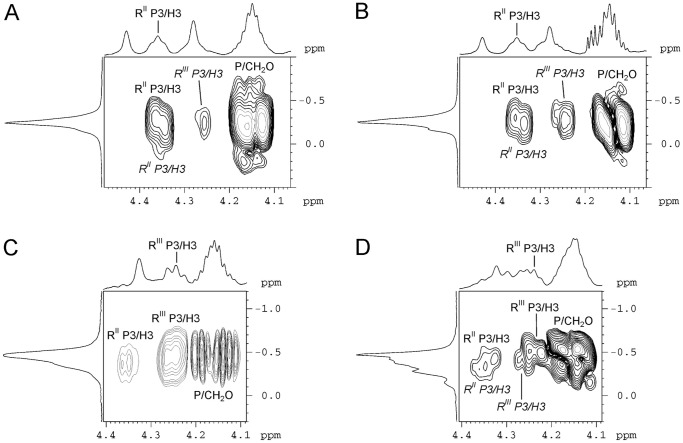
Figure 3. Parts of two-dimensional 1H, 31P HMBC spectra of the O-polysaccharides from S. flexneri serotype Xv (A) and transformant 51580_Xv (B) 4av (C) and transformant NCTC 9725_4av (D).
The corresponding parts of the 1H NMR and 31P NMR spectra are displayed along the horizontal and vertical axes, respectively. RII and RIII indicate RhaII and RhaIII, respectively. The annotations for the cross-peaks of the minor bisphosphorylated O-unit are italicized.

