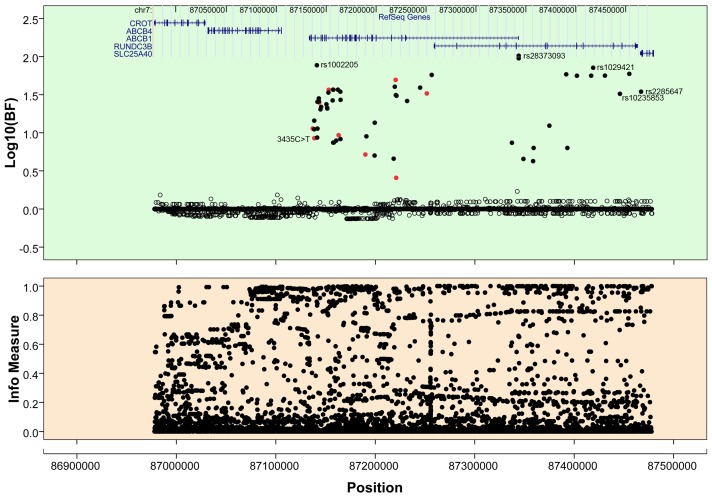
Figure 1. Association results of imputed loci using 1000 Genome datasets as reference panel.
The upper panel illustrates log-transformed BFs of single SNPs with Bayesian regression. The black dots are the imputed loci showing the associations with ABCB1 gene expression. The red dots represent Tag SNPs with significant associations. The lower panel indicates the infor measures of imputed loci. Physical coordinates in the figure are based on Human Reference Genome Sequence Build 37.

