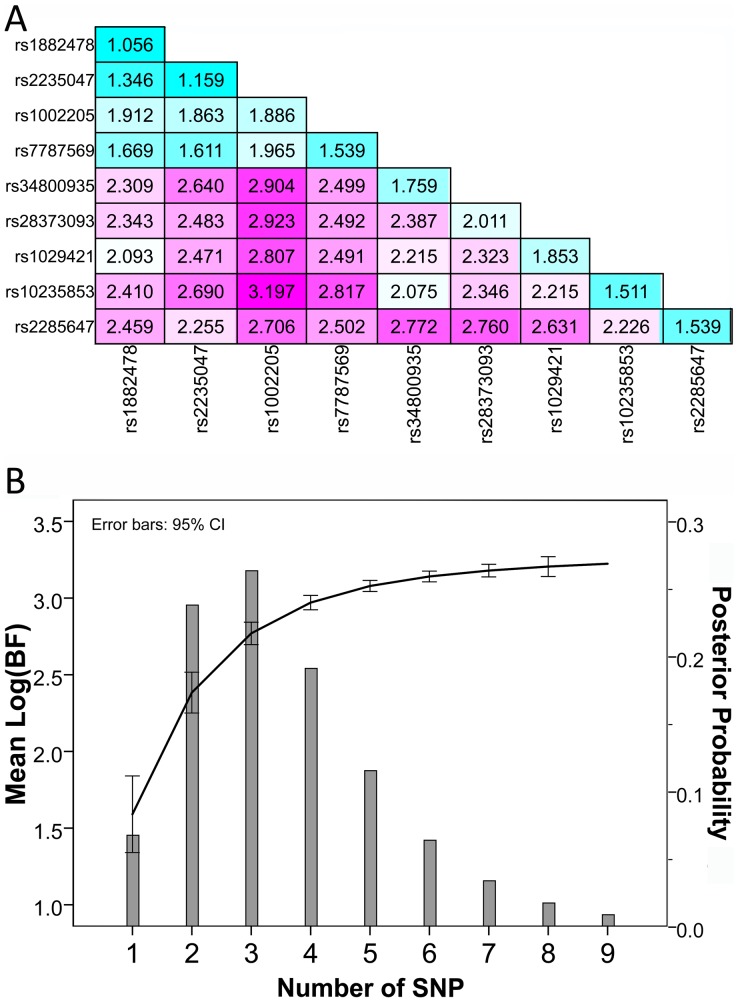
Figure 3. Multi-SNP results of Bayesian analyses.
(A) BF values of pairwise loci combinations in Multi-SNP analyses. The colors are corresponding to BFs. (B) BF values and posterior probabilities for different multi-SNP combinations. Means of BFs corresponding to different SNP combinations are charted in line, and means of posterior probabilities in bars.

