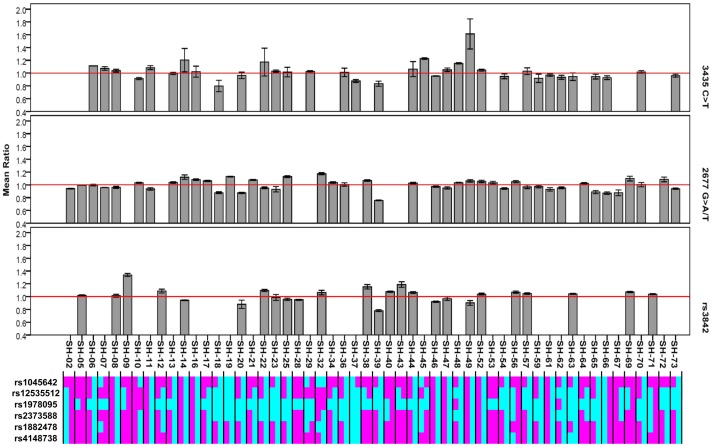
Figure 4. Allele specific ABCB1 mRNA expression in normal liver samples and the phases of Tag SNPs with significant associations.
In the upper panel, allelic expression ratios of samples heterozygous for at least one marker SNP are presented by bar plots. Each allelic expression ratio was independently measured in triplicate using SNaPshot. In the lower panel, each pair of columns represents the two phases of associated Tag SNPs in each sample heterozygous for marker SNP. Alleles associated with higher gene expression are denoted in pink, and alleles associated with reduced expression in cyan.

