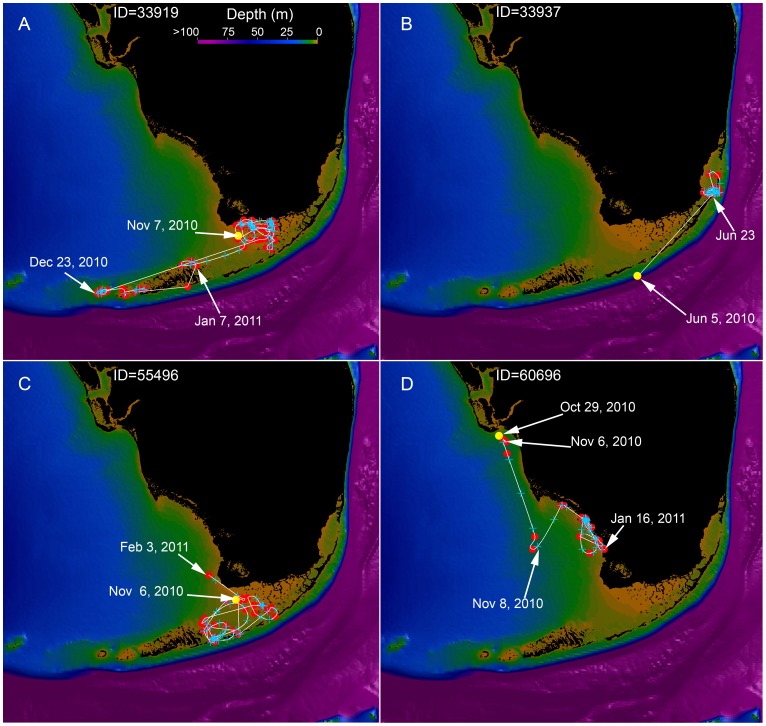
Figure 3. Representative example of four different bull shark tracks overlain on regional bathymetry.
Red dots indicate the Argos locations, the white line is the 1-minute Bezier interpolated track, and the blue plus symbols are the 12-hour positions. The yellow dot is the tagging location. The depth is scaled from 0 to 100 m as indicated by the color bar. Major geographic locations are labeled in Fig. 1.

