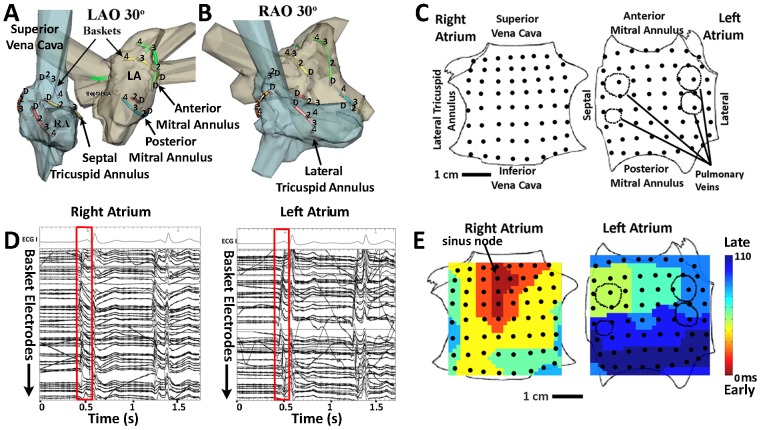
Figure 1. Electrical and Anatomic Mapping of Human Atria.
A. Basket catheter splines are represented as colored lines registered within the right (blue) and left (grey) atria in left anterior oblique and B. right anterior oblique projections. The figure shows alternate splines with positions D (distal) to 4 representing electrodes 1 to 8. C. Bi-atrial schematic showing right atrium as if opened at its poles and left atrium as if opened at its equator, with electrode positions (black dots). D. ECG leads I, aVF and V1 and electrograms of one sinus rhythm beat (red box) captured by baskets in right and left atrium. E. Maps of sinus rhythm activation (isochrones) from high right atrium (sinus node) to low lateral left atrium created from bi-atrial basket recordings.

