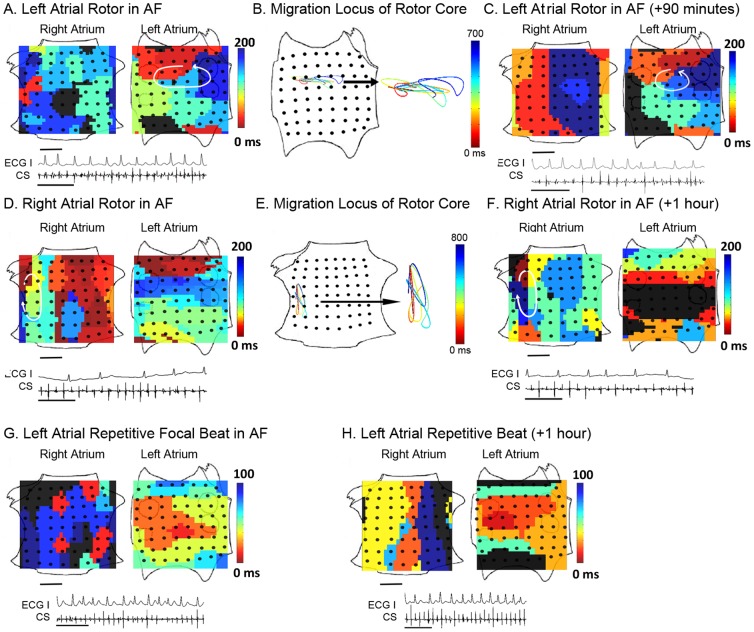
Figure 2. Stable Localized sources underlie human atrial fibrillation.
A. Isochrones show an LA rotor in paroxysmal AF, with electrograms during AF (ECG lead I and CS electrodes; scale bar 1 second). Activation times are color-coded (black indicates non-activated, diastole). B. Spatially constrained migration locus of the rotational center, computed every 25–45 ms and joined using third-order Bézier curve fitting. C. Isochrones 90 minutes later, indicating temporal conservation of the rotor. D. Isochrones of a RA rotor in persistent AF. E. Migration locus. F. Isochrones 1 hour later. G. LA repetitive focal beat in paroxysmal AF. H. Conservation of focal beat 1 hour later. In each case, ablation only at the source locus terminated AF within <5 minutes. Scale bar 1 cm.

