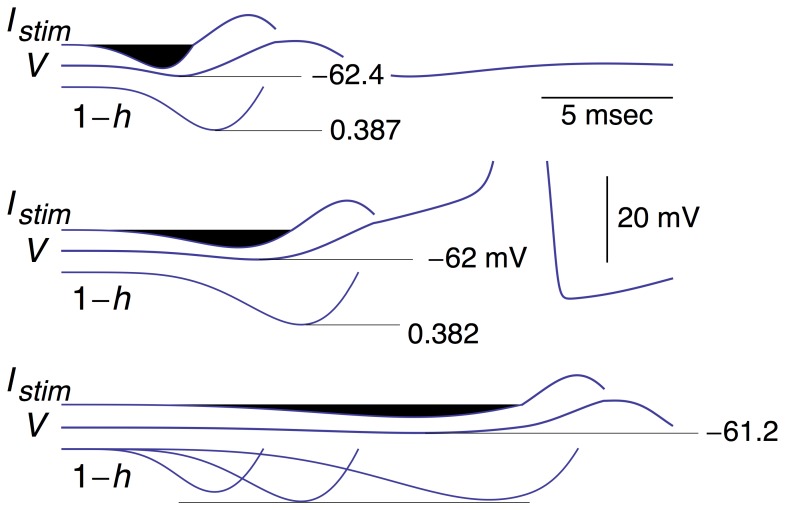
Figure 5. Same results as inFigure 4 with an expanded scale for the voltage axis of the three results and with 1−h shown below each simulation.
All three 1−h results are shown superimposed in the bottom panel. Note that the minimum level of V reached during the stimuli is, top to bottom, −62.4, −62, and −61.2 mV, respectively. The minimum level of h (removal of Na + channel inactivation) is, top to bottom, 0.387, 0.382, and 0.385, respectively.

