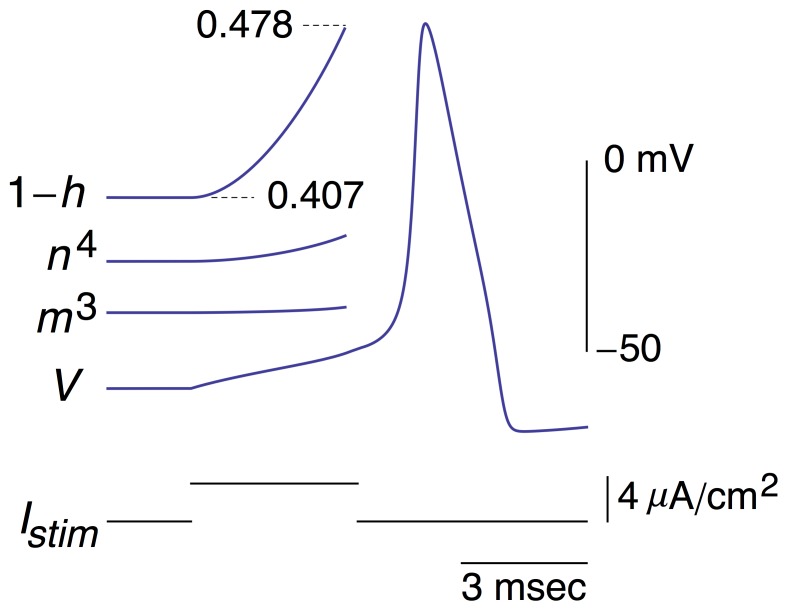
Figure 7. Ionic mechanism underlying response of the Hodgkin and Huxley model to a rectangular depolarizing current pulse.
The 1−h, n 4, and m 3 results correspond to the changes in these parameters from the beginning of the stimulus (Istim) until a point near threshold similar to that of the optimal stimulus in Figures 2 and 3. The scales for these results are the same as in Figure 3. Note in particular changes that occur in both n 4 and 1−h, in contrast the results in Figure 3, as well as the significantly larger change in 1−h relative to the results in Figures 2 and 3.

