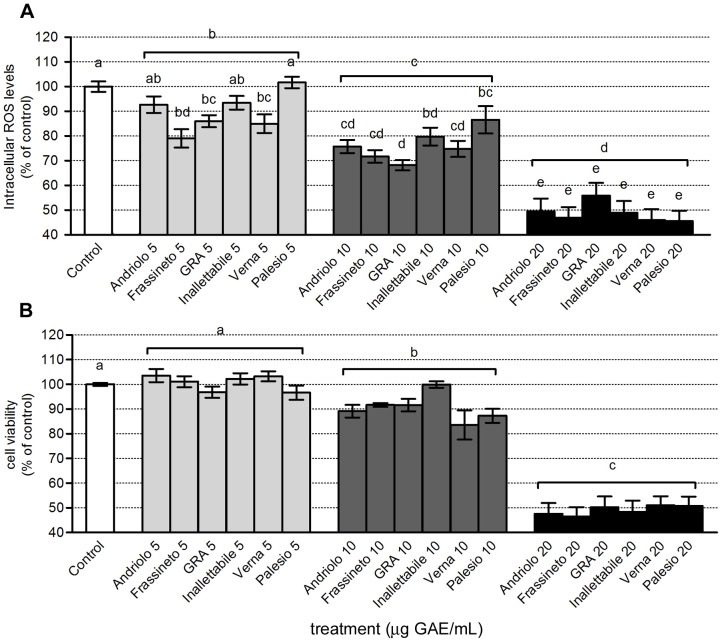
Figure 3. Evaluation of intracellular ROS production and cell viability in HL60 cell line.
HL60 cells were treated with different concentrations of phenolic extracts of different wheat varieties (5, 10, 20 µg GAE/mL) for 24 h and intracellular ROS production (A) and cell viability (B) were analyzed as reported in Material and Methods. Data, expressed as % of control, represent mean +/− SEM of 4 independent experiments, each in triplicate. Statistical analysis of differences was carried out by two way ANOVA followed by Fisher's LSD as post test. Different letters represent statistical significance: p<0.05.

