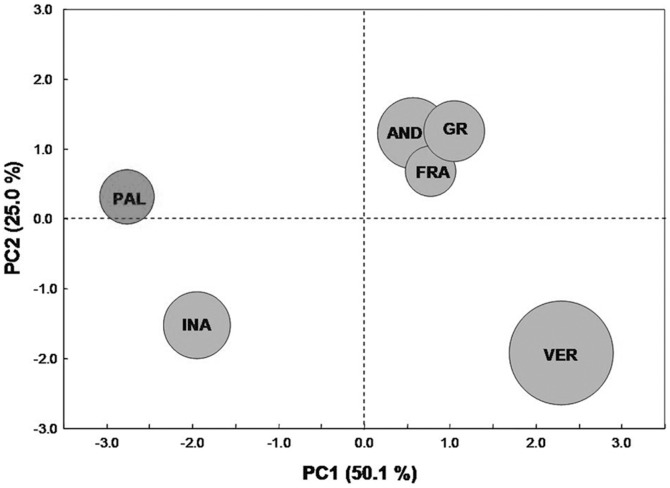
Figure 6. Principal component analysis based on seed anti-oxidant properties and seed extract activities at cellular level.
The scatter plot reports the projection of cases (6 wheat genotypes) on the first two components PC1 and PC2 (accounting for 75.1% of total variability): the diameter of each balloon is proportional to the variability observed for the wheat accession.

