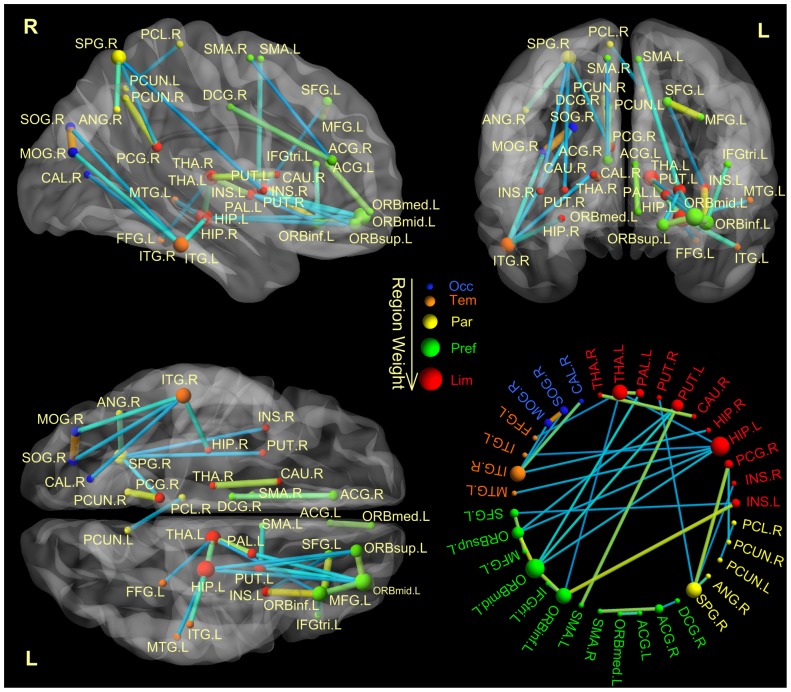
Figure 2. Region weights and distribution of the consensus anatomical connections.
The consensus anatomical connections are displayed both on a surface rendering of the brain and in a circle. The thickness of connections adjusts according to their connectivity strength. The connectivity for either low or high values is color-coded in blue and orange. The diameter of a sphere represents the corresponding region weight of a ROI. The ROIs are color-coded according to brain areas (red, limbic cortex; green, prefrontal cortex; yellow, parental cortex; orange, temporal cortex; blue, occipital cortex). R = right hemisphere, L = left hemisphere. SFG = Superior Frontal; ORBsup = Superior Orbital Frontal; MFG = Middle Frontal; ORBmid = Middle Orbital Frontal; IFGtriang = Inferior Triangular Frontal; ORBinf = Inferior Orbital Frontal; SMA = Supplementary Motor Area; ORBsupmed = Medial Orbital Frontal; INS = Insula; ACG = Anterior Cingulate; DCG = Middle Cingulate; PCG = Posterior Cingulate; HIP = Hippocampus; CAL = Calcarine; SOG = Superior Occipital; MOG = Superior Occipital; FFG = Fusiform; SPG = Superior Parietal; ANG = Angular; PCUN = Precuneus; PCL = Paracentral Lobule; CAU = Caudate; PUT = Putamen; PAL = Pallidum; THA = Thalamus; MTG = Middle Temporal; ITG = Inferior Temporal. Brain networks are visualized using the BrainNet Viewer (http://www.nitrc.org/projects/bnv/).

