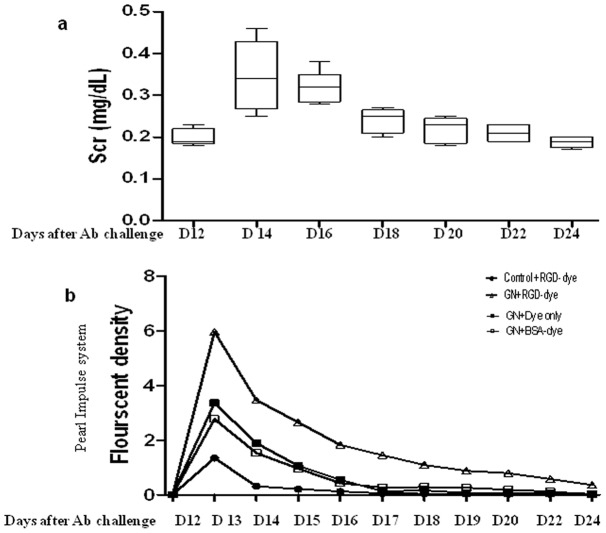
Figure 5. Correlation of renal function changes in anti-GBM disease with renal RGD probe accumulation in serial images.
(a) The Scr levels were assayed every 2 days, and the longitudinal changes in Scr levels are plotted. A peak corresponding to high Scr levels was observed around D13–D19 after anti-GBM disease induction. The longitudinal accumulation of the renal RGD probe, as captured by the Pearl® Impulse system (b) is plotted in phase with the serum creatinine changes.

