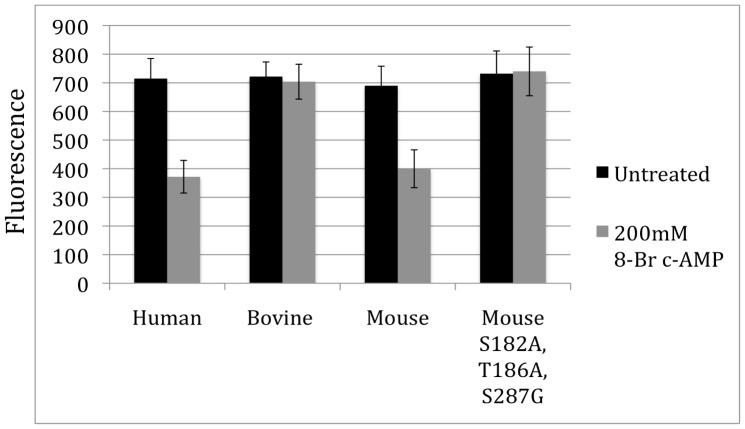
Figure 8. Functional consequences of natural variation in PKA phosphorylation sites.
Graph of the peak calcium response of human, bovine, mouse melanopsin and the mouse melanopsin mutant (S182A,T186A, S287G) as measured by the fluorescent calcium assay. In black is the average maximum fluorescence for untreated cells, while 200 µM 8-Br cAMP treated response is shown in grey. Error bars represent standard deviation.

