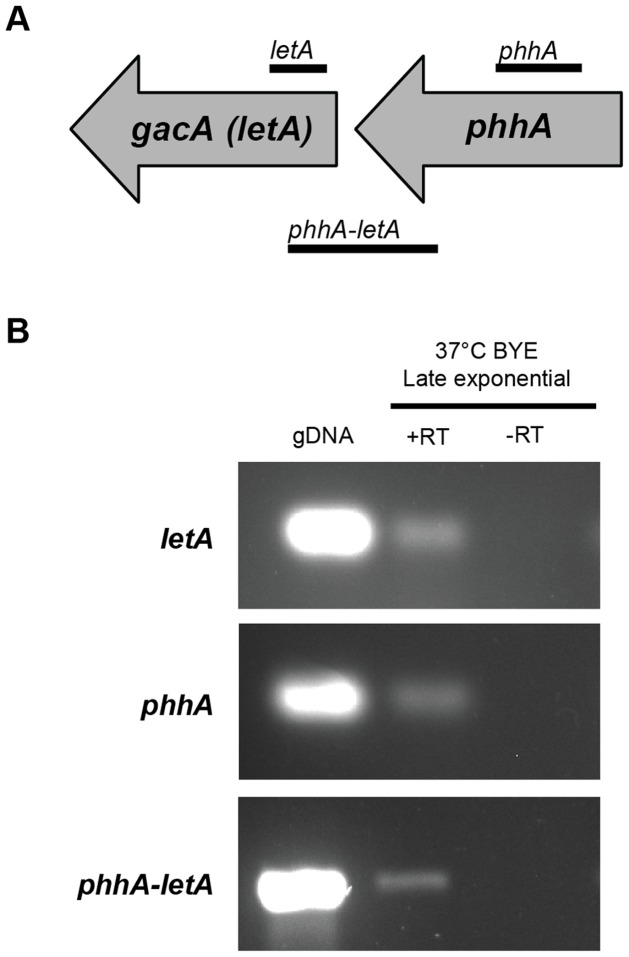
Figure 3. Transcriptional linkage between phhA and letA.
(A) The gray horizontal arrows denote the phhA and letA genes. The thin horizontal lines below the genes signify the approximate size and location of transcripts identified by RT-PCR analysis, including an intergenic transcript. (B) Wild-type strain 130b was grown in BYE at 37°C, and then RNA was analyzed by RT-PCR utilizing primer pairs specific to either phhA, letA, or the intergenic region spanning phhA and letA. That the PCR products obtained resulted from mRNA templates was confirmed by the lack of product obtained when the PCR did not incorporate RT (-RT). PCR products obtained from genomic DNA appear in the left-most lanes, indicating that the mRNAs observed are full-length. The results presented are representative of at least three independent experiments.

