
Figure 8. Conformational stability of lpPAH.
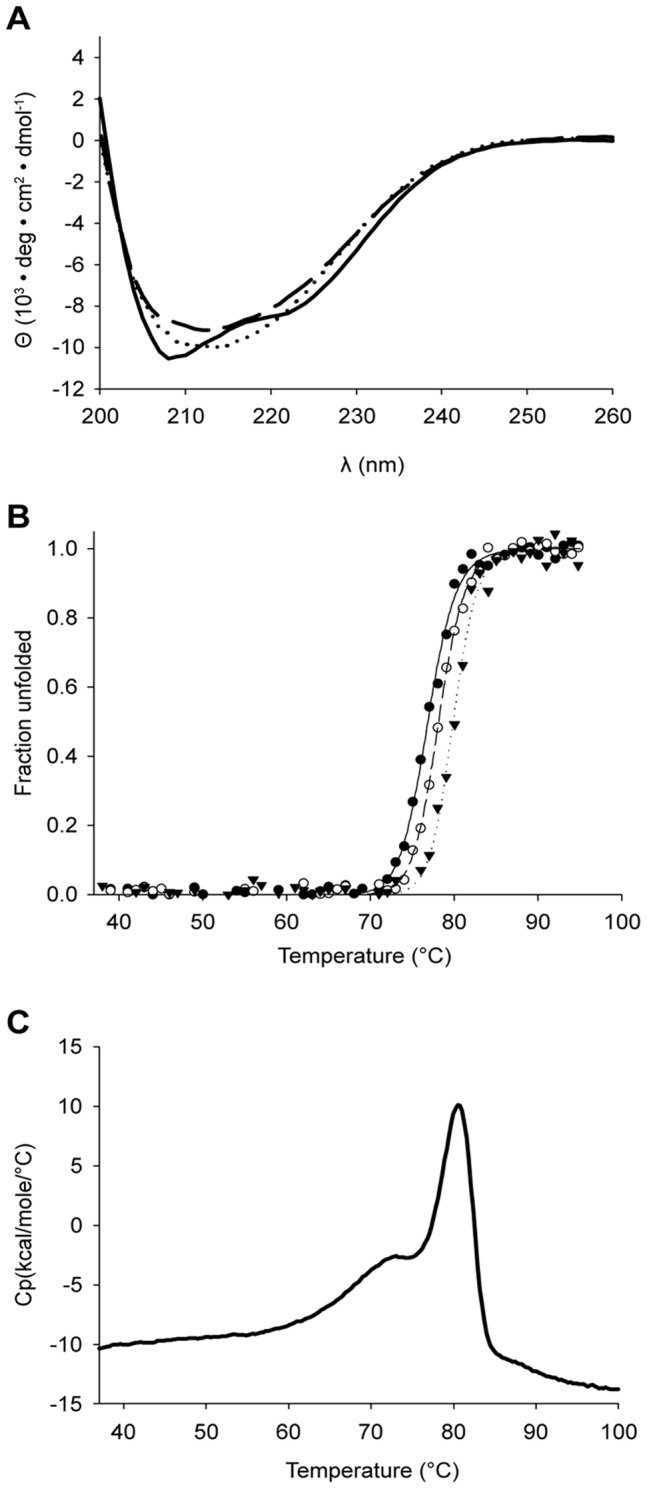
(A) Far-UV CD spectrum of lpPAH (6 µM in 50 mM Na-phosphate buffer, pH 6.5) at 37°C (____), at 85°C (––) and at 37°C after heating the sample to 100°C (⋅⋅⋅⋅⋅). [θ], mean residual ellipticity. (B) CD-monitored (at 222 nm) thermal denaturation lpPAH (6 µM in 20 mM Na-Hepes, 200 mM NaCl, pH 7.0) without (•) or with (○) 6 µM Fe(II) (added as ferrous ammonium sulphate) and 6 µM Fe(II) and 5 mM L-Phe (▾). The lines show a fitting of the data to a two-state unfolding equation [79] and points are averaged over ten data points after conversion to fraction unfolded [80]. (C) DSC-monitored thermal denaturation of lpPAH (30 µM) in 20 mM Na-Hepes, pH 7.0. The scan rate was 1°C/min.