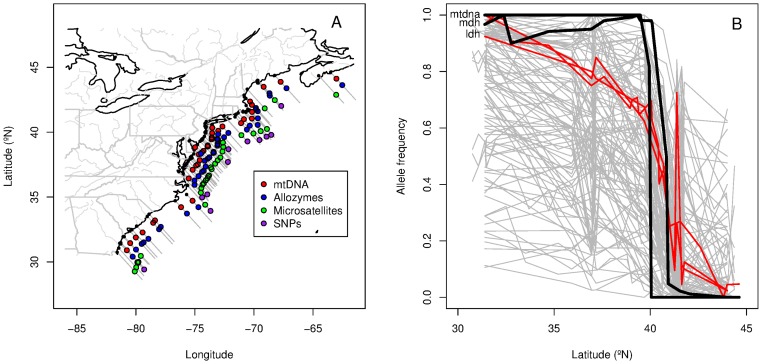
Figure 1. Sampling locations and allele frequencies in Fundulus heteroclitus.
A) Location of sampled populations. B) Allele frequences of clinal loci used in the Genomic Co-Co plot analysis. mtDNA and Mdh allozyme clines are highlighted in black, and Ldh allozyme and Ldh SNP clines are highlighted in red.

