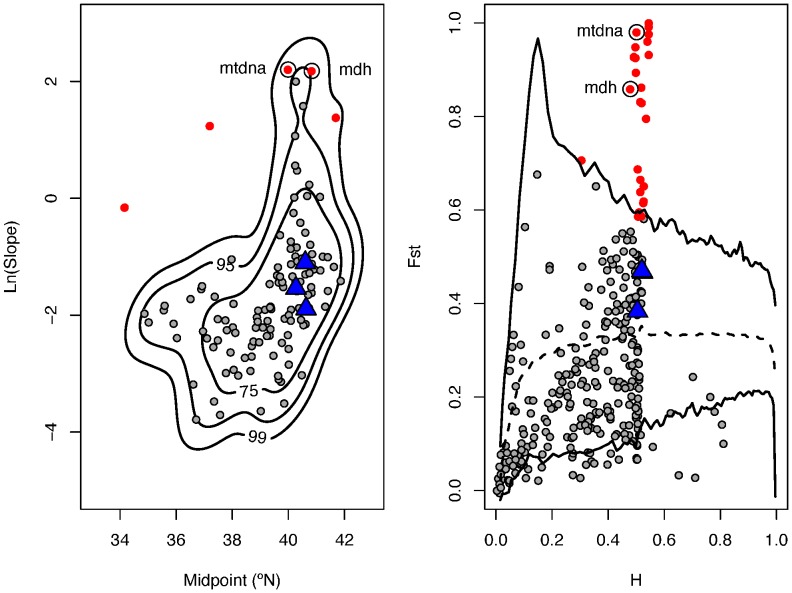
Figure 2. Identification of outlier loci based on Genomic Co-Co plot (left panel) and fdist2 (right panel) analyses.
Contours of 75, 95 and 99% are shown on the co-co plot. Mean FST is dotted and 99% C.I. lines are in black on the fdist2 panel. Outlier loci are in red (95% C.I.), non-outlier loci are in grey, and Ldh allozyme and SNPs are blue.

