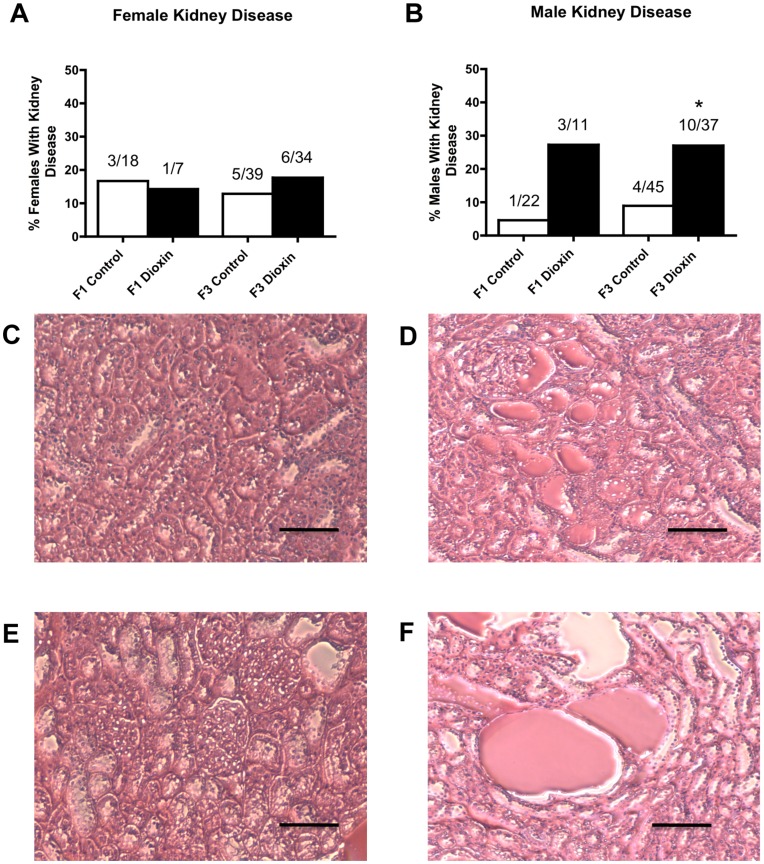
Figure 1. Dioxin and control lineage F1 and F3 generation adult-onset kidney disease.
Percentages of females (panel A) and males (panel B) with kidney disease and number of diseased rats/total number of rats (*P<0.05). Micrographs (Scale bar = 200 µm) show kidney disease in F3 generation dioxin lineage (panel E and F) compared to control (panel C and D) for female (panel C and E) and male (panel D and F).

