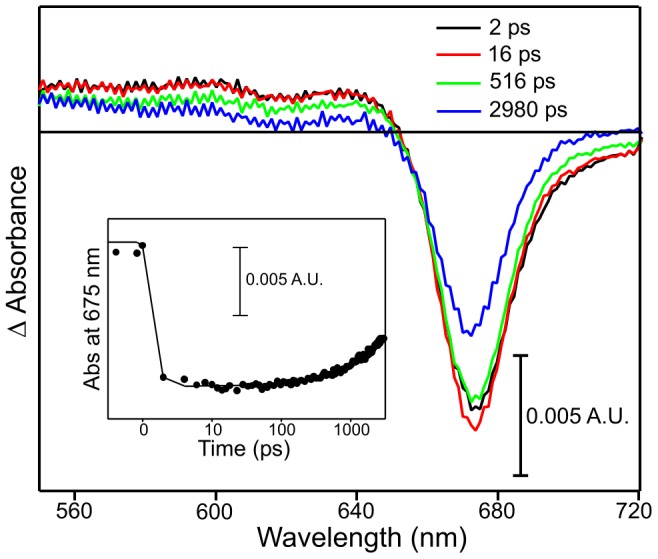
Figure 4. Pump-probe absorption spectroscopy of ‘Chlide only’ sample.

Spectra are shown after photoexcitation with a laser pulse centred at ∼475 nm. The main panel shows transient absorption difference spectra at delay times of 2, 16, 516 and 2980 ps after excitation. The inset shows the respective kinetic transients at 675 nm (black circles) with a fit of the data to a single exponential (solid line).
