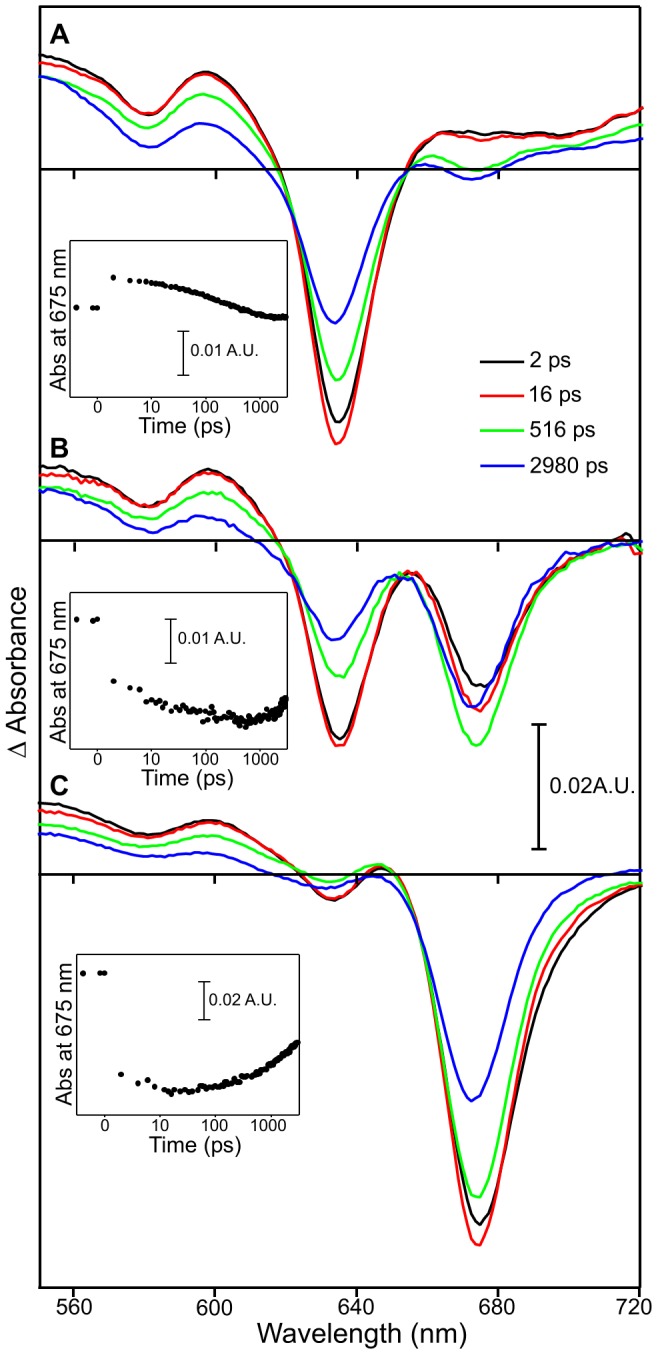
Figure 5. Pump-probe absorption spectroscopy of samples containing a mixture of Pchlide and Chlide.

Spectra are shown after photoexcitation with a laser pulse centred at ∼460 nm. The main panels show transient absorption difference spectra at delay times of 2, 16, 516 and 2980 ps after excitation for samples containing a mixture of 90% Pchlide and 10% Chlide (A), 50% Pchlide and 50% Chlide (B) and 10% Pchlide and 90% Chlide (C). The insets show the respective kinetic transients at 675 nm (black circles).
