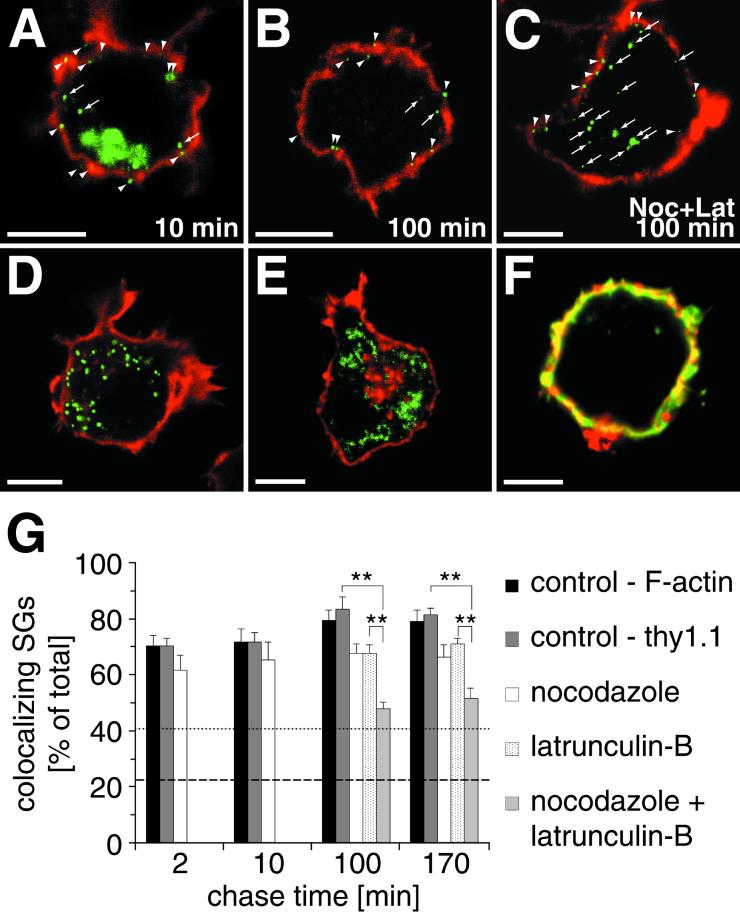
Figure 5.
SGs are restricted to the F-actin-rich cell cortex during maturation. The colocalization of hCgB-GFP(S65T)-fluorescent SGs (A–C), peroxisomes (D), or mitochondria (E) with F-actin (A, B, D, and E, red signal) or immunostained Thy1.1 (C, red signal) was analyzed. Arrowheads and arrows indicate colocalizing and noncolocalizing organelles, respectively, with cortical staining. (F) A cell double-stained with FITC-phalloidin (green) and anti-Thy1.1 (red). Note the extensive colocalization (yellow) of both markers. (A–C) Cells transfected with hCgB-GFP(S65T) were incubated for 2 h at 20°C, chased for indicated times in the absence (A and B) or presence (C) of nocodazole and latrunculin-B (for details see MATERIALS AND METHODS), fixed, and then stained for the cortex (F-actin or Thy1.1). The clustered green fluorescence in A indicates the TGN, the green puncta in A–C represent fluorescent SGs. (D) Cells transfected with PTS1-GFP show greenfluorescent peroxisomes. (E) Cells incubated with Mitotracker show fluorescent mitochondria (shown in green). The red staining in the TGN area visible in some but not all cells indicates the presence of F-actin. (G) Quantitative analysis of colocalization. For each condition, cells were analyzed by confocal sectioning. The amount of colocalization between cortical markers and hCgB-GFP(S65T)-fluorescent SGs (bars), peroxisomes (dotted line) or mitochondria (dashed line) was determined by the use of 3D software (see MATERIALS AND METHODS). Error bars, SE. Significance (p < 0.01) is indicated by ∗∗. For all conditions at least six cells from two independent experiments were quantified. Note that in the presence of latruculin-B or latrunculin-B plus nocodazole cells were only analyzed after 100 and 170 min of chase.

