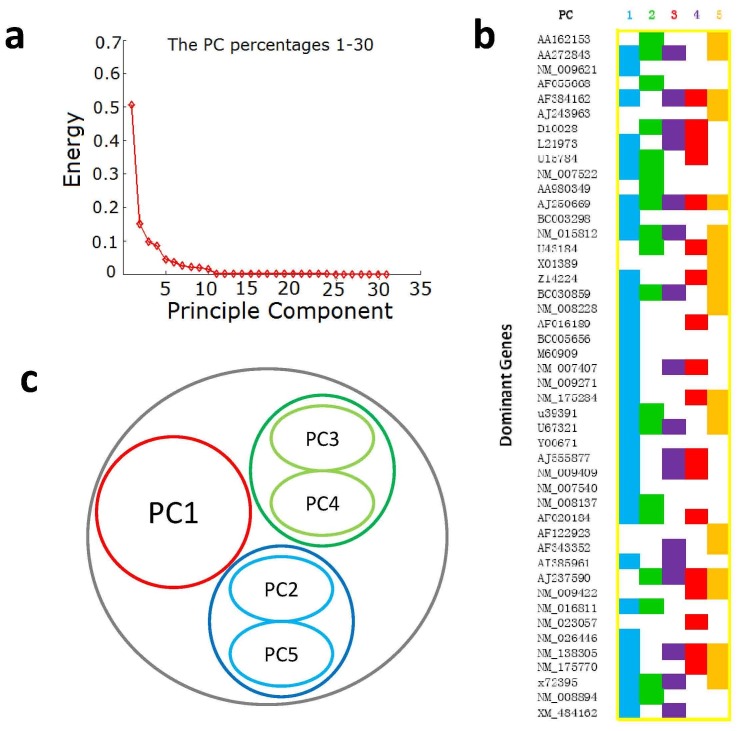
Figure 4. Principal component analysis of the gene expression profiles.
(a) The Principal component analysis (PCA) energy ranking, in which the top five Principal components (PCs) account for >95% of total energy. (b) The distribution of the 373 genes in the five PCs, according to their normalized PCA values. Most of genes in each PC are located between ±0.2, while the minorities of genes outside this range are selected as dominant genes of a PC. (c) The clustering of PCs. Distributions of dominant genes shows that PC 2 and PC 5, and PC 3 and PC 4 have the similar mode, but PC 1 is unique.

