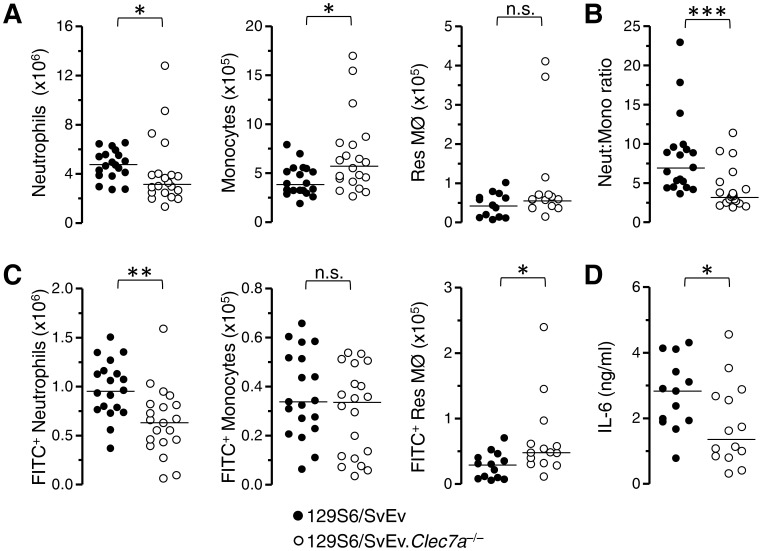
Figure 2. Characterization of high-dose zymosan peritonitis in Dectin-1-deficient mice.
Wild type (closed circles) and dectin-1-deficient (Clec7a −/−; open circles) 129S6/SvEv mice were injected intraperitoneally with 2×10⁷ zymosan particles and inflammatory infiltrates examined 4 hours later. A) Graphs showing the number of neutrophils, monocytes and residual tissue resident MØ (Res MØ) in the peritoneal cavity at this time. B) Graphical representation of a ratio of the absolute neutrophil and monocyte counts in each individual mouse. C) Graphs showing the numbers of those cells indicated in (A) above that are associated with FITC-zymosan. D) Quantification of IL-6 in the peritoneal lavage fluid of zymosan injected mice. For A,C and D data were normalized and pooled from 2 (Res MØ and IL-6 analysis) and 3 (Neutrophil and monocyte analysis) independent experiments. Each symbol represents an individual mouse. Horizontal lines denote medians. Data were analyzed by non-parametric Mann-Whitney U-test.

