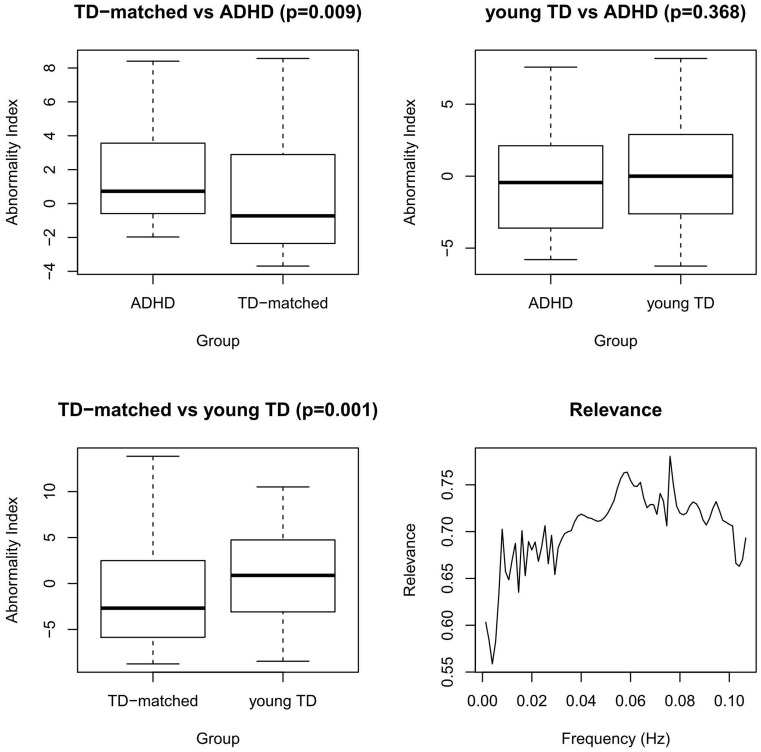
Figure 4. ADHD-200 Sample: Boxplots of the abnormality indexes of pairwise comparisons between groups at different ages.
Bottom-right: relevance of each frequency in discriminanting ADHD patients from TD age-matched controls. These findings are very similar to the ones obtained in the adults dataset.

