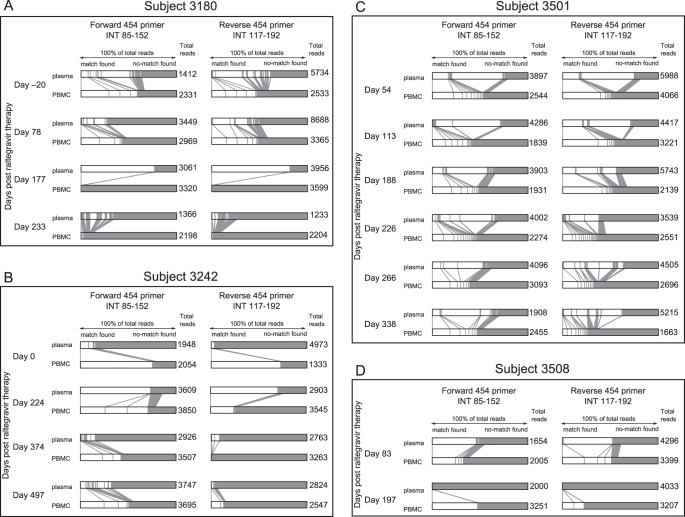
Figure 2. Absolute sequence homology comparison revealed 21% to 99% of sequences derived from PBMC samples had no identical match in their plasma counterparts.
An absolute sequence homology comparison revealed prolonged and substantial differences between plasma and PBMC viral populations. (A) Subject 3180, (B) Subject 3242, (C) Subject 3501, and (D) Subject 3508. 454 “deep” sequencing sampled an average of 3345 sequences from each sample. The forward 454 primer covered HIV-1 integrase (int) amino acids at approximately position 83–152 (210 bases), and the reverse primer covered approximately position 117–192 (228 bases). Within each sample, identical sequences were grouped, and the prevalence of each group of unique sequences was calculated. Next, a pair of plasma and PBMC collected from the same subject at the same time point was compared. Each group of identical sequences within a PBMC sample was compared with all the sequences derived from the plasma. The result was graphed on individual horizontal bars in this figure, in which each bar represents 100% of the total viral population sampled. When a match was found (defined by 100% nucleotide similarity and a minimum overlap of 73 bases and a maximum overlap of 228 bases), the corresponding sections in the horizontal bars were shaded white and a vertical/slanted line was drawn to link the two identical groups from the two compartments. Solid grey shading represents sequences that found no match. Note that the white sections represent groups of identical sequences, but in contrast the grey sections represent all sequences that found no match and thus represent a heterogeneous mixture of sequences.

