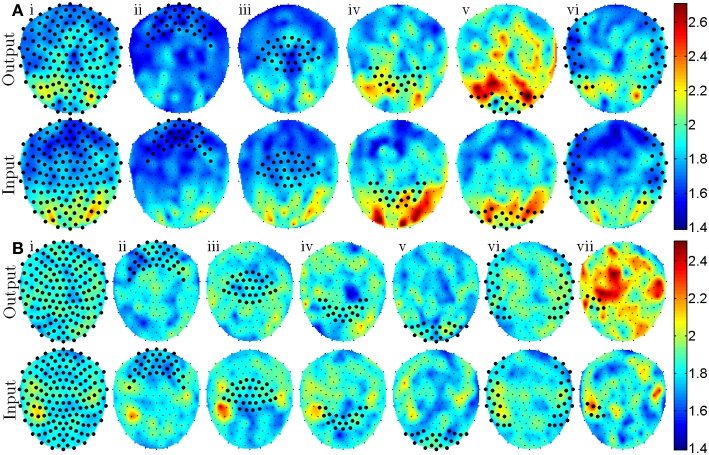
Figure 2.
Topographic plots show the sensor positions where the most notable differences in GC features exist [mean t-statistics defined by Equations (2) and (3)] for the visually cued experiment (A) and the aurally cued experiment (B). Top rows of (A and B) indicate regions of major difference in free and forced GC features that have outputs from sensors denoted with large markers. Bottom rows of (A and B) indicate regions of major difference in free and forced GC features that have inputs to sensors denoted with large markers. Roman numerals i–vi denote sensor groupings that include all, frontal, central, parietal, occipital, and temporal sensors with a post-hoc addition of grouping vii that includes a portion of left temporal sensors.

