
Figure 2. An example of an epicardial ECG recorded from an isolated rat heart during simulated autonomic conflict.
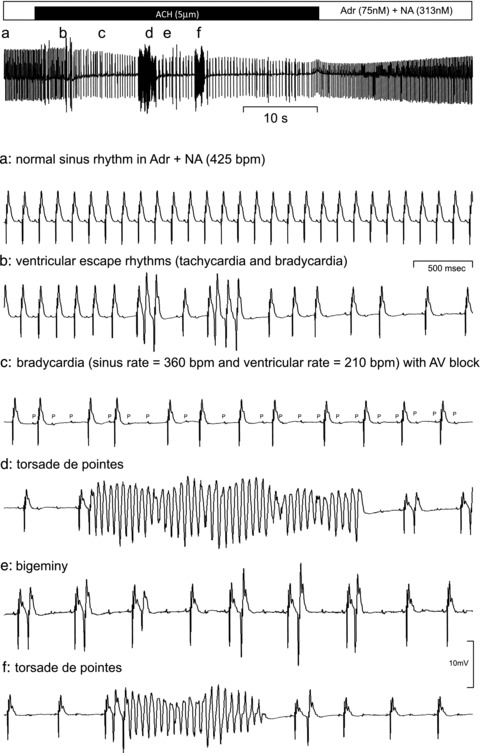
The heart was perfused with a constant background concentration of adrenaline (75 nm) and noradrenaline (313 nm) and a 1 min period of acetylcholine (ACh: 5 μm) was superimposed as indicated. The top trace shows a slow time-base recording and the arrhythmias recorded at the points marked a–f on this trace are expanded below.