
Figure 6. NADPH oxidase activity in KCC3+/+ and KCC3−/− murine neutrophils.
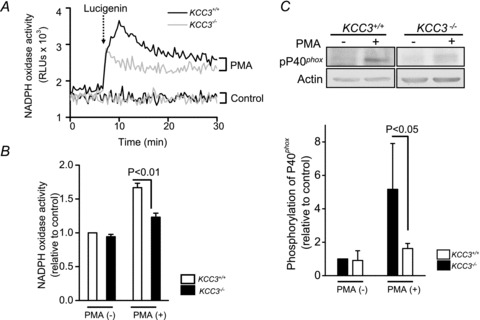
A, the representative real-time cumulated ROS recordings by the chemiluminescence assay in KCC3+/+ and KCC3−/− murine neutrophils with or without 10 nm PMA stimulation. The dotted arrow indicated the adding of lucigenin. The control group was neutrophils treated with 0.1% DMSO alone. B, impaired ROS production in KCC3−/− murine neutrophils. The area under the curve was calculated as the total ROS production for a 30 min period after adding lucigenin. The ROS production in KCC3+/+ group without PMA stimulation was used as the control and the others were expressed relative to the control. Each value represented the mean ± SEM (n= 6). C, a representative immunoblot of phosphorylated p40phox in KCC3+/+ and KCC3−/− neutrophils from three independent experiments. The phosphorylation level of p40phox in the KCC3+/+ group without PMA stimulation was used as the control and the others were expressed relative to the control.