
Figure 1. Resting  and
and  (mmHg) in CBD (A and C, respectively) and Sham (B and D, respectively) animals before and at multiple time periods after sham or CBD surgery in BN, SS and SD rats.
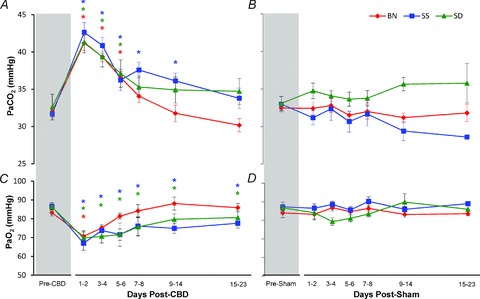
Red, blue and green asterisks, significantly (P < 0.05) different from pre-CBD values for BN, SS and SD rats, respectively.