
Figure 4. Ventilation ( ; ml min−1) and
  (mmHg) during room air and CO2 breathing before, 1–4 and 10 or more days following CBD in BN (A), SS (B) and SD (C) rats.
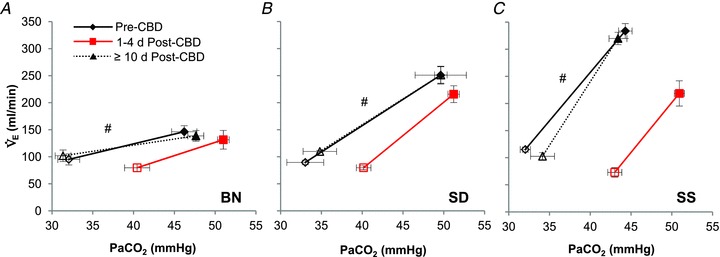
#Slope of relationship (Δ /Δ
/Δ ) different (P < 0.05) from other strains.