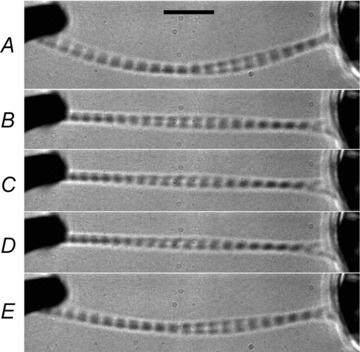
Figure 1. Images of myofibrils during the following steps: relaxation (A), isometric contraction in standard activating solution (B), isometric contraction with oscillation at 84 Hz (C), isometric contraction with oscillation at 30 Hz (D), and relaxation (E).

The amplitude of oscillation was 0.12%L0. Because of the flow of the solution (top to bottom), the myofibrils are bent in A and E; the myofibrils are not bent in B, C and D, because of the active tension development. The scale bar in A corresponds to 10 μm. Sarcomere length (SL) was: A, 2.70 ± 0.02 μm (mean ± SEM of n= 20 sarcomeres); B, 2.57 ± 0.04 μm (n= 19); C, 2.53 ± 0.06 μm (n= 19); D, 2.48 ± 0.05 μm (n= 19); E, 2.63 ± 0.03 μm (n= 20).
