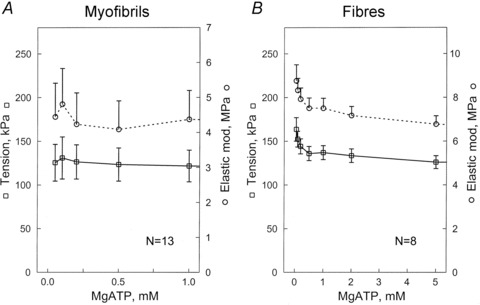
Figure 3. Tension (left ordinate, open squares) and elastic modulus (Y∞, stiffness) (right ordinate, open circles) during activation of single myofibrils (A), and single muscle fibres (B).

Both are plotted as a function of the [MgATP]. Experiments were carried out at pCa 4.35–4.65 in the presence of 8 mm Pi, and at 200 mm ionic strength and pH 7.00. Error bars represent the SEM for 13 experiments in A, and for 8 experiments in B.
