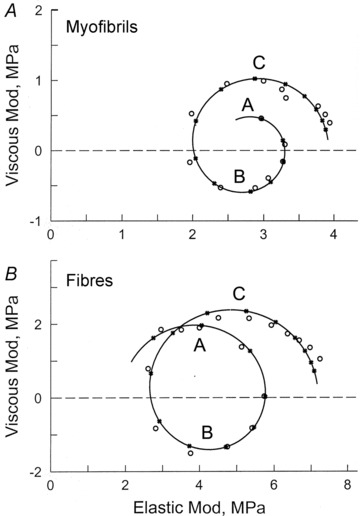
Figure 4. Comparison of Nyquist plots for single myofibrils (A), and single muscle fibres (B), during maximal activation with 1S solution (1 mm MgATP, 8 mm Pi).

Data points (x25CB;) represent the average for 13 experiments in A, and for 8 experiments in B. The continuous curves were established based on best-fit to eqn (1). Frequency is the intervening parameter, and is represented by a data point (x25CB;) and its calculated value (•). Frequencies used in A are 1, 2, 3.2, 5, 7, 11, 15, 21, 30, 42, 60, 84, 120, 170 and 250 Hz (clockwise direction). Frequencies in B are 0.25, 0.5, 1, 2, 3.2, 5, 7.5, 11, 17, 25, 35, 50, 70, 100, 135, 187 and 250 Hz. Some of the frequencies are different to avoid an interference from the power line (50 Hz in Germany, 60 Hz in USA). Processes A, B and C are marked. These are represented by individual semicircles. In the case of the myofibril experiments at low frequencies, floating objects interfered with the optical path of the laser beam and thereby introduced noise; thus, experiments at 0.25–0.5 Hz were not included for myofibrils.
