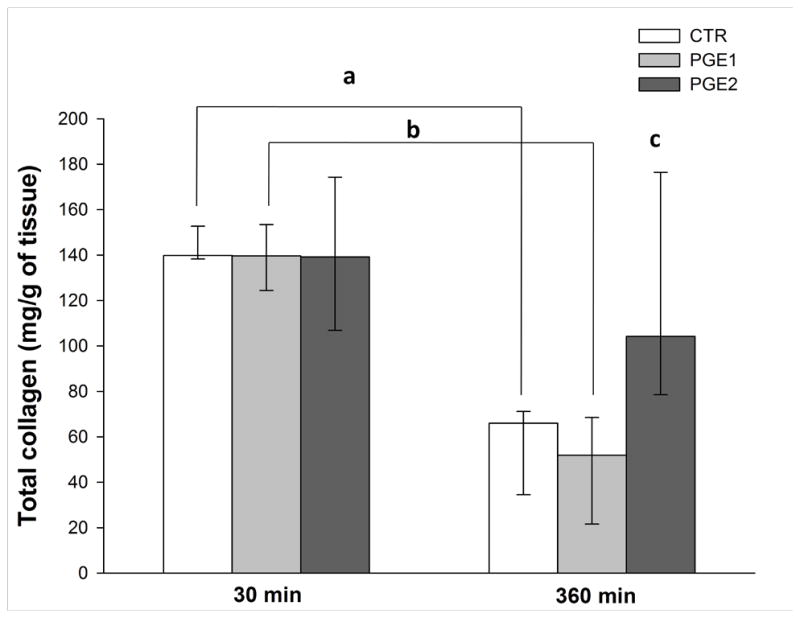
Figure 2. Total collagen concentration (mcg/g dry tissue) in samples removed at 30 or 360 minutes.

Two Way Analysis of Variance on Ranks followed by Holm-Sidak post hoc test. 30 min vs 360 min p < 0.01; a: p = 0.002; b: p = 0.004; c: PGE2 vs PGE1 and CTR at 360 min p < 0.01. Data are reported as median [IQR].
