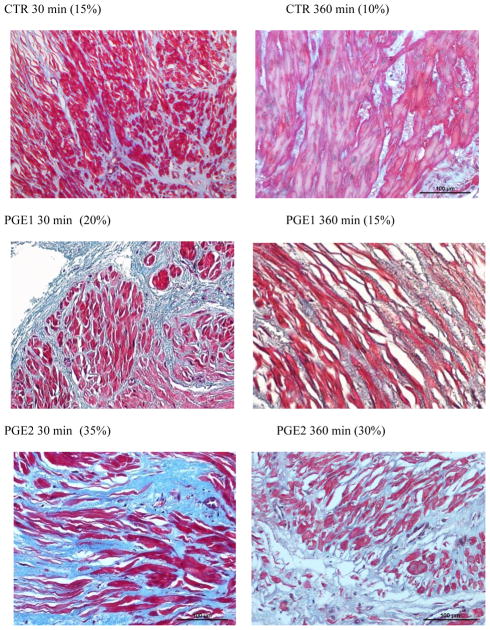
Figure 3. Representative histology from myometrial samples treated with PGE1 and PGE2, as well as CTR collected at 30 and 360 min and stained with Masson Trichrome.
After generating a digital image, the area covered by connective tissue (stained in blue) was measured as percent of the total section area; muscle fibers were stained red. Original magnification: 20X

