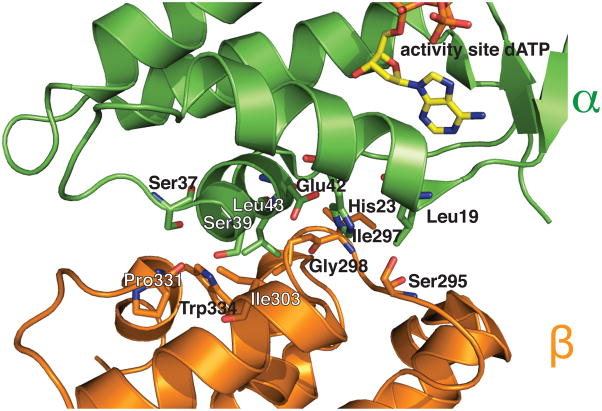
Figure 3.
Detailed view of the α-β interface within an α4β4 ring. Protein is shown in ribbons with residues found near the interface shown in sticks. Residue names and numbers are labeled. α is colored in green and β in orange (carbons same color as ribbon, oxygen in red, nitrogen in blue) with dATP bound at the activity site in sticks (carbon in yellow, oxygen in red, nitrogen in blue, phosphorus in orange). Additional close-up views of interfaces and distances between α2 and β2 subunits are shown in Fig. S1.

