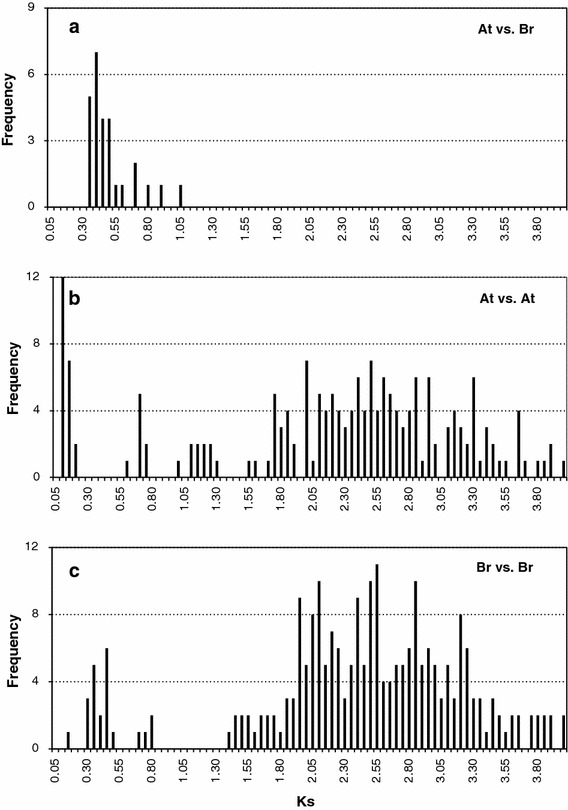
Fig. 5.

Age distribution of ARF genes in the genome of A. thaliana (At) and B. rapa (Br) viewed through the frequency distribution of relative K s modes. Distributions of K s values were obtained from orthologous gene sets (a) between the genomes and paralogous genes sets (b, c) in the A. thaliana and B. rapa genomes. The vertical axes indicate the frequency of paired sequences and the horizontal axes denote the K s values at 0.05 intervals. The black bars depict the positions of the modes of the K s distribution obtained from orthologous or paralogous gene pairs
