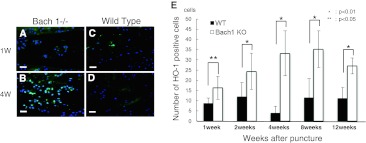
Fig. 8.
Distribution of HO-1 protein in the center of the intervertebral disc. Typical examples showing immunofluorescence of HO-1 (green) and nucleus (blue) in sagittal sections of intervertebral discs from Bach 1−/− (a, b) and wild-type (c, d) mice. Scale bar = 40 μm. The number of HO-1 positive cells in the center of the intervertebral disc in one visual field of ×400 (e). From 1 week to 12 weeks, the number of HO-1 positive cells in Bach 1−/− mice was significantly greater than that of wild-type mice at any period of time

