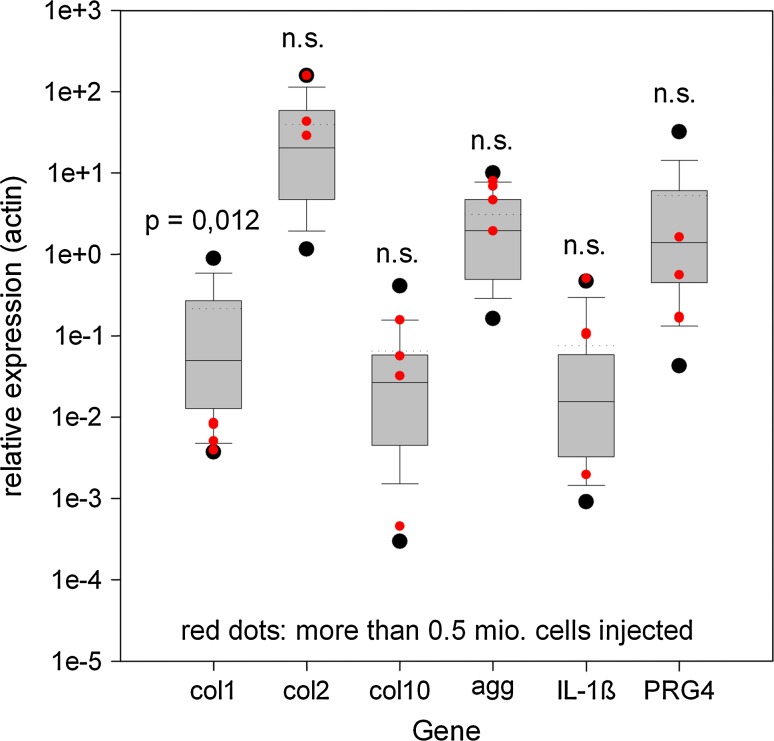
Fig. 5.
Global expression patterns for the genes analyzed in the study. As in Fig. 4, all data were pooled, irrespective of treatment or anatomical origin. The red dot group (increased cell numbers injected) is numerically included into the box plots. Because of the lack of statistical normality, the mean (dotted lines) and medians (hairlines within the boxes) differ in some groups (Mann–Whitney Rank Sum Test). Data are presented as 2−dCt relative to β-actin expression

