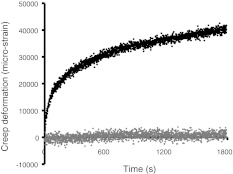
Fig. 2.
Typical ‘creep’ curves for the anterior region of an L3 vertebral body (male, 89 years) during a 30-min test. Initial elastic deformations have been omitted to enhance the contrast between the very slight creep of the undamaged vertebra (lower graph) and the much greater creep that follows vertebral microdamage (upper graph). Note that creep appears to be a continuous process, even in the damaged vertebra, and that the rate of creep (gradient of the graphs) falls steadily with time. Data are shown before smoothing

